Ceburu Log Management – Probe Installation and Setup
Ceburu supports both WinRM and non-WinRM configurations for log management.
This flexibility allows seamless integration in varied environments and supports multi-probe (dual probe) architectures for redundancy and scalability.
Before installation, ensure:
WinRM is enabled on Forwarder, and Collector systems (for WinRM-based setup).
Network connectivity is available between these components.
Administrator privileges are available on the installation machine.
- Go to
https://portal.ceburu.com/and log in - On the left-hand menu, scroll down and click More Features

3. You will be redirected to https://portal.ceburuai.com where the Log Management module will open.
4. Click on the Download icon located in the dashboard.
5. Download and install the Ceburu Probe on the designated probe machine by following the on-screen installation instructions.
Note: Ensure the probe machine meets the minimum system requirements and has internet access for successful installation.


After downloading the installer, follow these steps:
Locate the Installer: Go to your Downloads folder and double-click the CeburuProbeInstaller.exe file.

Accept the License Agreement: Review the license terms and click I Agree to continue.

Configure Settings: Enter any required configuration details, such as the Portal URL or Authentication Key provided in the portal.

Provide the Probe Listening Port and click Install.

Complete the Installation: Click Install to begin the installation process. Once complete, click Finish to exit the setup.


Verify Installation: After installation, the probe service should start automatically. You can verify this in the Services panel by checking for Ceburu Probe Service status.
After installation:
Navigate to Configurations → Network Discovery in the Ceburu Portal.
You will see the registered probes listed under Registered Probes:
Primary Probe – Main discovery node responsible for initiating network scans and device communication.
Secondary Probe – Optional backup or extended discovery node used for redundancy or distributed scanning.
Both probes should display a Connected status once communication is successfully established.
Note: Adding a Secondary Probe is optional. It can be used to improve coverage or provide failover capabilities but is not mandatory for the setup to function.
If the Primary Probe (and optional Secondary Probe, if configured) is connected, the setup is complete.

Configure Network Scan
Go to Configurations → Network Discovery in the Ceburu Portal.
Click Configure Network Scan.
In the popup window, enter the Subnet/IP Address (for example:
192.168.33.0/24).Click Add to include the subnet, then select Create Profile & Start Scan.
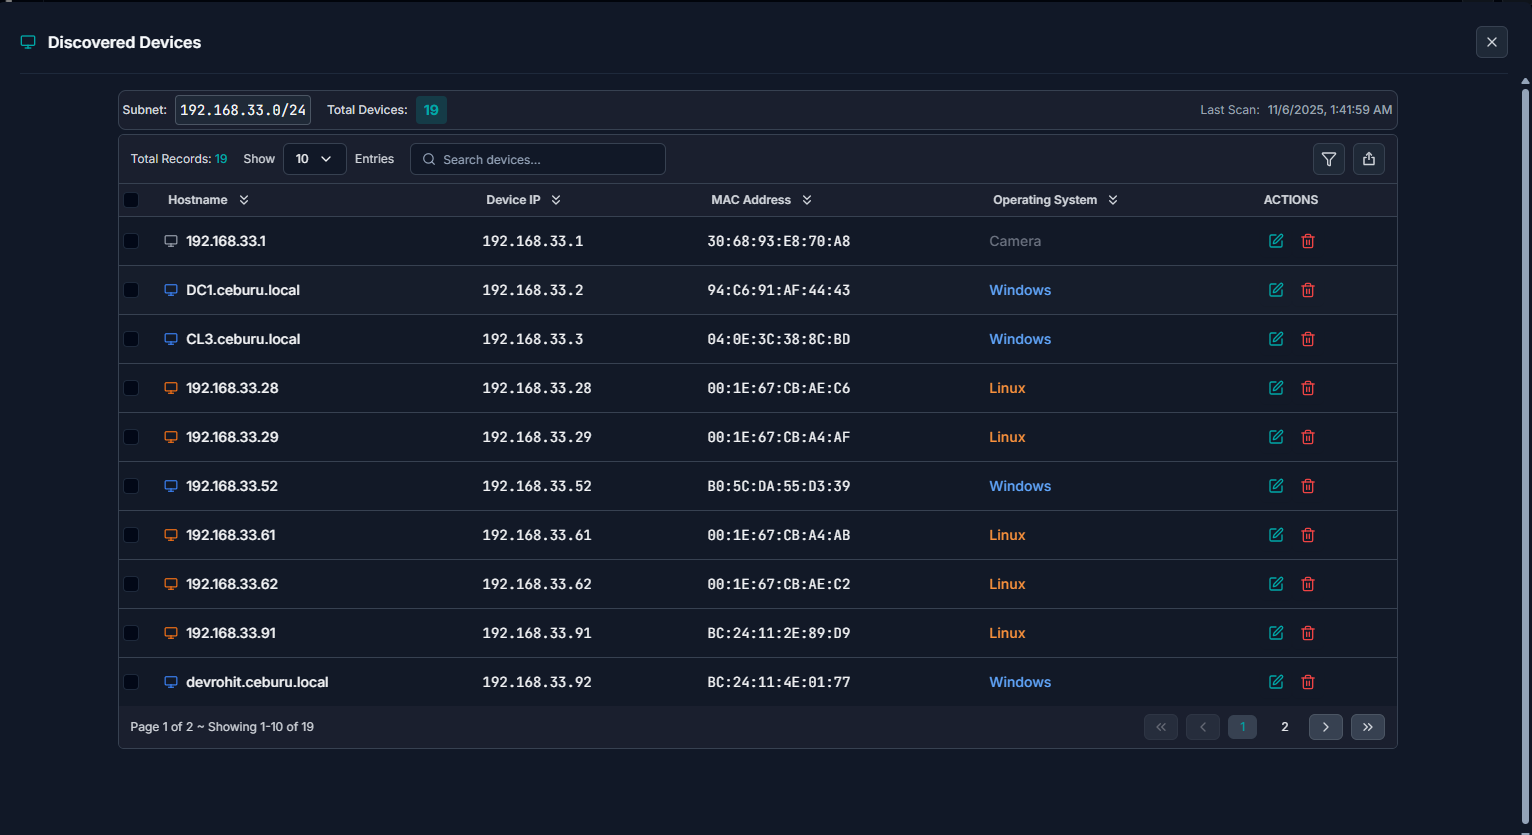
The system will start scanning the provided subnet. Once completed, the scan results will display the total number of detected devices along with their IP addresses and hostnames.


Viewing Discovered Devices
After a successful scan, click the eye icon next to the scan profile to view the discovered devices.
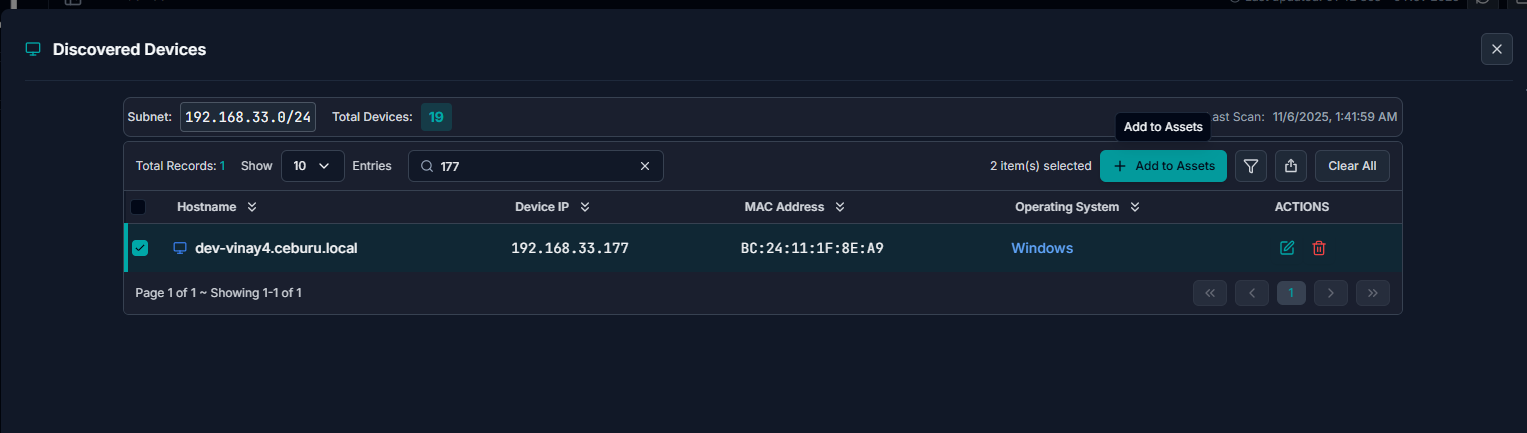
To add the devices to your managed inventory, select the desired devices and click Add to Assets.
Once added, devices will appear under Configurations → Assets.

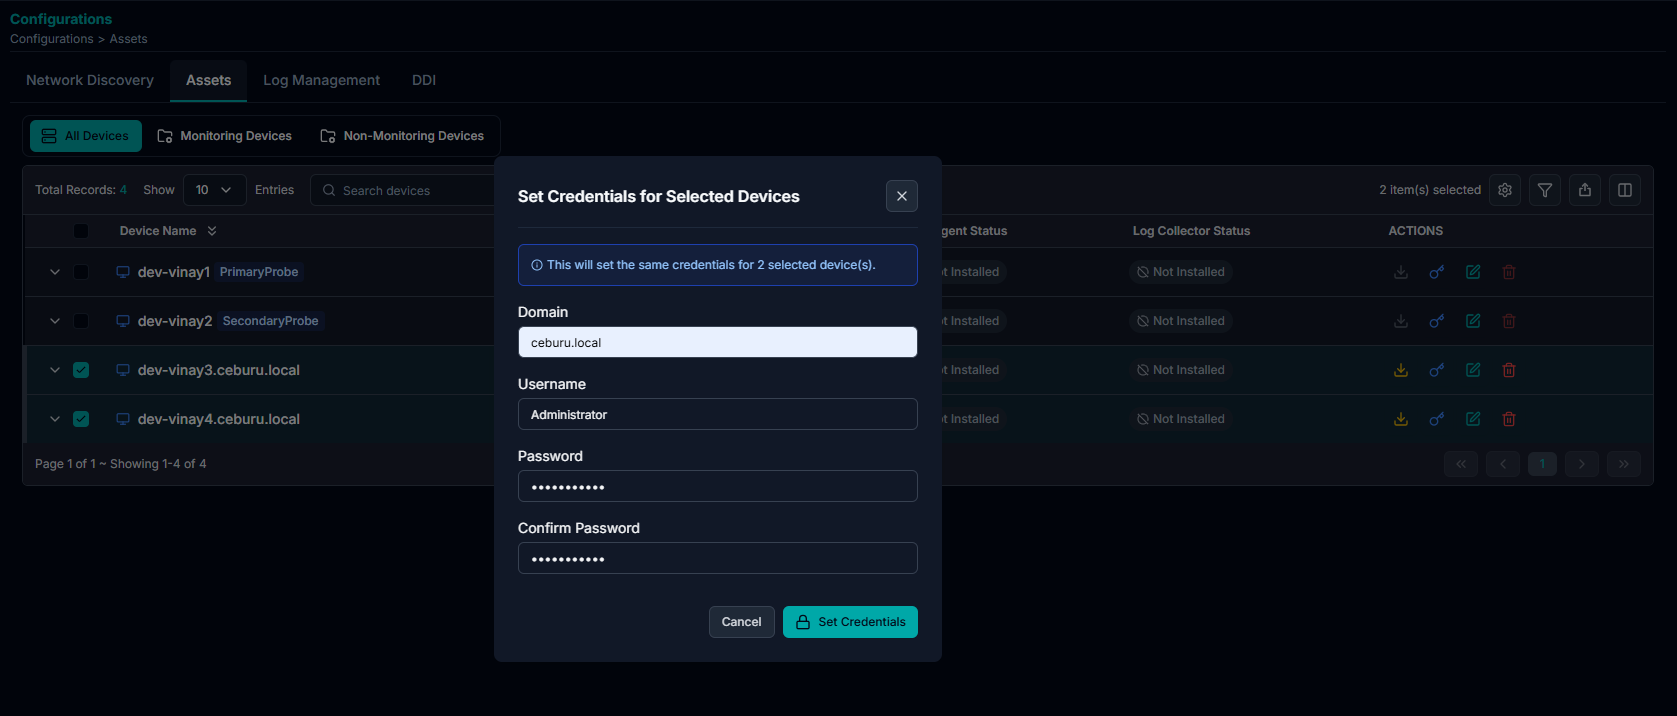
Setting Device Credentials
Before deploying the End Agents, credentials must be set for the target devices:
In the Assets tab, select the devices you want to configure.
Click the Key icon or select Set Credentials from the top-right dropdown.
Enter:
Domain
Username
Password and Confirm Password
Click Set Credentials to apply the credentials to the selected devices.
Once devices are added under Assets and credentials are configured, you can install the Ceburu End Agent to enable endpoint log collection and monitoring.
Ceburu supports installation with WinRM enabled as well as without WinRM, offering flexibility for different network environments.
Installing End Agent
If WinRM is enabled, deploying the End Agent is optional, as data can be collected directly through WinRM.
However, if WinRM is not supported or disabled, you can install the Ceburu End Agent manually to enable communication between the endpoint and the Ceburu Probe.
1. Installing with WinRM Enabled
Go to Configurations → Assets in the Ceburu Portal.
Select the devices where you want to install the End Agent.
Click the dropdown menu (top-right corner) and choose Install Agent for bulk action or click download icon in the table to install agent.
The installation will automatically begin on the selected devices through WinRM communication.
Once the installation completes successfully, the End Agent Status will update to Active.
Note: WinRM must be enabled on the devices and accessible from the Ceburu Probe for the agent to deploy remotely.


2. Installing without WinRM Enabled
If WinRM is not enabled in your environment, you can perform a manual installation using the downloadable installer.
Go to Configurations → Downloader.
Under Available Files, select Ceburu Agent Installer.
Click Download to obtain the setup file.
Run the installer (
Ceburu-Agent-Setup.exe) on the target device.- The Ceburu-AI Agent Setup wizard will open.
- Click Next to begin the setup

Accept the License Agreement
Read through the Ceburu Software License Agreement.
Click I Agree to continue the installation process.

In this step, you’ll provide connection parameters for the agent to communicate with the probe.
Probe IP: Enter the IP address of the registered Ceburu Probe (for example:
192.168.33.174).Probe Port: Enter the listening port configured during the probe setup (default:
7878).API Key: Paste the Agent Token from the Downloader page in the Ceburu Portal.
After filling in the details, click Install to begin the deployment.

The installer will extract and copy the required files to your system directory.
Wait until the progress bar completes.
When installation finishes, click Finish to close the wizard.

After installation:
Go to the Ceburu Portal → Configurations → Assets.
The installed device will automatically appear in the Assets list.
The End Agent Status will update to Active once communication with the probe is established.

Log Management – Log Forwarder and Collector Installation
Ceburu’s Log Management module supports a distributed architecture using Log Forwarders and Log Collectors for efficient log ingestion and routing.
Forwarders handle log transport between agents and collectors, while collectors perform aggregation and normalization before sending logs to the analytics engine.
1. Access the Log Management Configuration
Navigate to Configurations → Log Management.
You will see two sections:
Log Forwarders Configuration
Log Collectors Configuration

2. Setup a Log Forwarder
Click the Setup Log Forwarder button (top-right corner).
In the setup window:
Select Device: Choose the device where the forwarder will be installed (for example, your Primary Probe).
Forwarder Port: Specify the port number (default is
24224).Note: The port cannot be changed after the forwarder is created.
Click Install Forwarder to begin deployment.

Once the installation is complete:
The forwarder will appear under Log Forwarder Configuration.
Its status will update to Installed and then Active once connected successfully.
Install multiple forwarders for redundancy or for different network zones.

Install Log Collectors
After setting up the forwarders, you can deploy Log Collectors to capture and process logs.
There are two installation options:
Option A: Install Individually
Under the Log Collectors section, locate the device where you want to install the collector.
Click the Download icon next to the device entry.
The collector will automatically install and begin connecting to the assigned forwarder.
Option B: Bulk Installation
Select multiple devices in the Log Collectors section.
From the top-right dropdown menu, choose Deploy Collector.
The collectors will be installed on all selected systems simultaneously.

Verify Deployment
Once installation is complete:
Forwarders will appear under Log Forwarder Configuration with a status of Active.
Collectors will appear under Log Collectors with the Collector Status showing Active.
If any collector or forwarder shows as Inactive or Failed, click the restart icon under the Actions column to retry or troubleshoot.
Configure Log Source:
Go to the Log Management tab. Click on Add Log Source in the Log Sources section.

Enter Log Source Details
- Identifier Tag: Enter a unique identifier for the log source.
- Querying Tags: Add any tags that will help filter or query the logs.

Specify Log File Configuration
- File Path: Provide the absolute path to the log file on the device.
- File Pattern: Define any file matching pattern (e.g., *.log).
- Parser: Choose the appropriate parser to interpret the log format.

Choose the device where the logs are located. Click Create Log Source to complete the setup.

Once added, the new log source will appear in the Log Sources list for monitoring and analysis.

Make sure the file path and permissions are correct on the target device to avoid collection errors.
Was this article helpful?
That’s Great!
Thank you for your feedback
Sorry! We couldn't be helpful
Thank you for your feedback
Feedback sent
We appreciate your effort and will try to fix the article