The Meraki Monitoring section provides real-time tracking and management of network devices, enabling you to view basic details about each device, such as the device name, model, IP address, type of device, and firmware version.
It also displays data regarding the latitude and longitude coordinates for the physical location.
Network details, such as serial number, LAN IP Address, WAN 1IP address, and WAN 2IP address are also displayed for each device monitored.
Additionally, you can view data regarding the Port Traffic, Endpoints, Metrics, Top Conversion, Client Traffic, Top Services, OSI (Open Systems Interconnection) Model, Event Logs, Errors, and AI Recommendations for each device. For more information, refer to Viewing Individual Device Metric Data in Meraki Monitoring.
Viewing Individual Device Metric Data in Meraki Monitoring
You can view additional data to analyze a device’s performance based on Meraki Monitoring.
1. Navigate to AI Monitoring > Operational Analysis> Meraki Monitoring.
The Meraki Monitoring page is displayed.

2. Click the radio button against the device you wish to view the metrics.
3. Scroll down the page to view the Merkai Metrics.

You can view the following metrics on respective tabs for each device.
Port Traffic
The Port Traffic tab provides graphical and tabular representations of port traffic usage and detailed port information for the selected device as follows:
PORT TRAFFIC USAGE
The PORT TRAFFIC USAGE displays a graph representing the amount and type of data transmitted and received through a specific network port for the selected device over a given period.
The statistical data for inbound, outbound, and total traffic usage is displayed when hovering the mouse over the graph.

PORT DETAILS
The PORT DETAILS displays a table with information regarding the various ports connected to the selected device, such as the Port No, Client Count, Power Usage, Speed, Status, Inbound data usage, Outbound data usage, and Total data usage.

Endpoints
The Endpoints tab displays information regarding the Endpoints connected to the selected device, hostname, IP address of the host, Mac ID, and Inbound, Outbound, and the total amount of data usage at each Endpoint.

Metrics
The Metrics tab displays the following graphs with data representing the network traffic over time.
Note: You can select the duration from the Select Period dropdown list to get real-time information regarding network traffic over the selection timeframe.
Observed Traffic (bits/s)
This graph displays the observed network traffic over time for the selected device in bits per second (bps).
When you hover the mouse over the chart, the statistical data for network traffic over a specific time is displayed.

Observed Traffic (pkts/s)
This graph displays the observed network traffic in packets per second (pkts/s) for the selected device.
Upon hovering the mouse over the chart, the statistical data of the network traffic over a specific period is displayed.

Top Conversation
The Top Conversation tab displays the most significant data exchanges between a selected device on various networks, measured by the volume of data transferred and the number of packets exchanged.
The Top Conversation data is displayed in the following sections:
Note: You can select the duration from the Select Period dropdown list to get real-time information regarding network traffic over the selection timeframe.
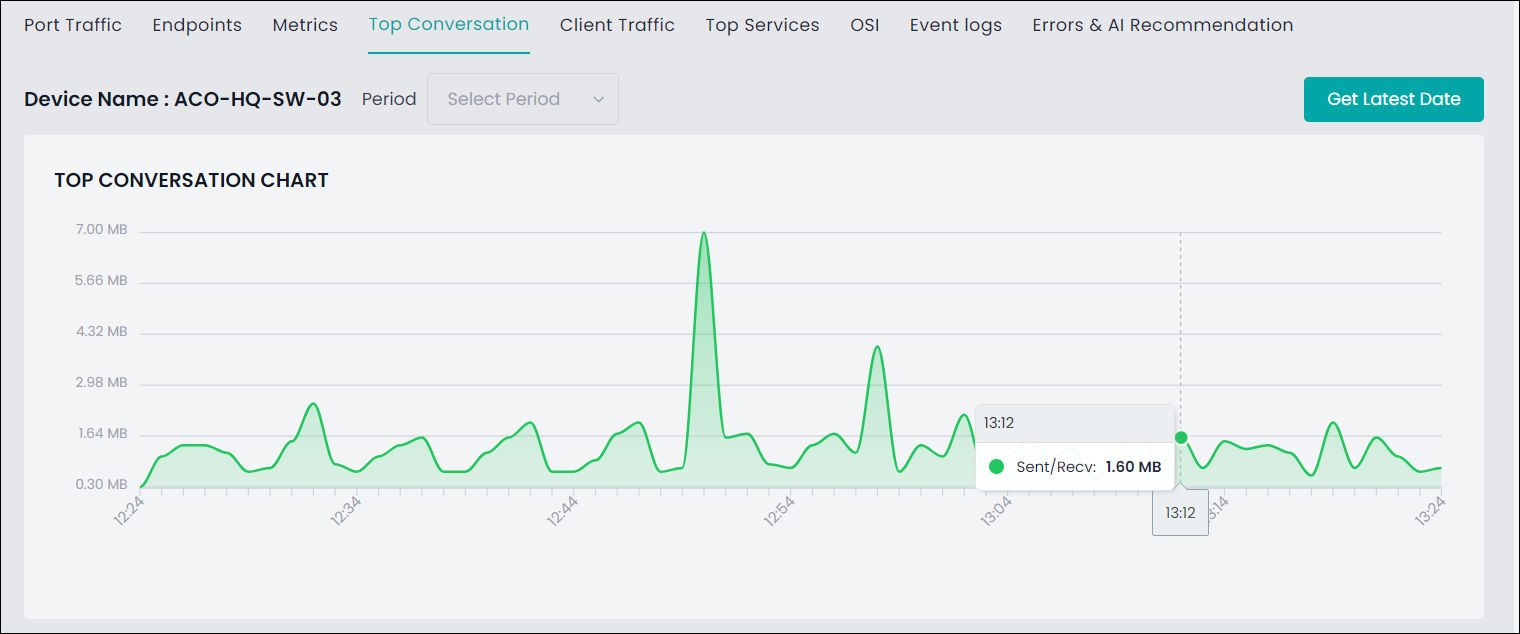
TOP CONVERSATION CHART
The TOP CONVERSATION CHART shows the data sent and received over time, measured in megabytes (MB) in a graphical representation.
TOP CONVERSATION DETAILS
The TOP CONVERSATION DETAILS displays detailed information about the top data conversations on the selected device in a tabular format, including the application used, client identifier, IP address of the client, server hostname, IP address of the server, amount of data transferred, and number of packets transferred.

Client Traffic
The Client Traffic tab displays client traffic usage data on a device for various networks. You can view the Client Traffic data in 2 sections:
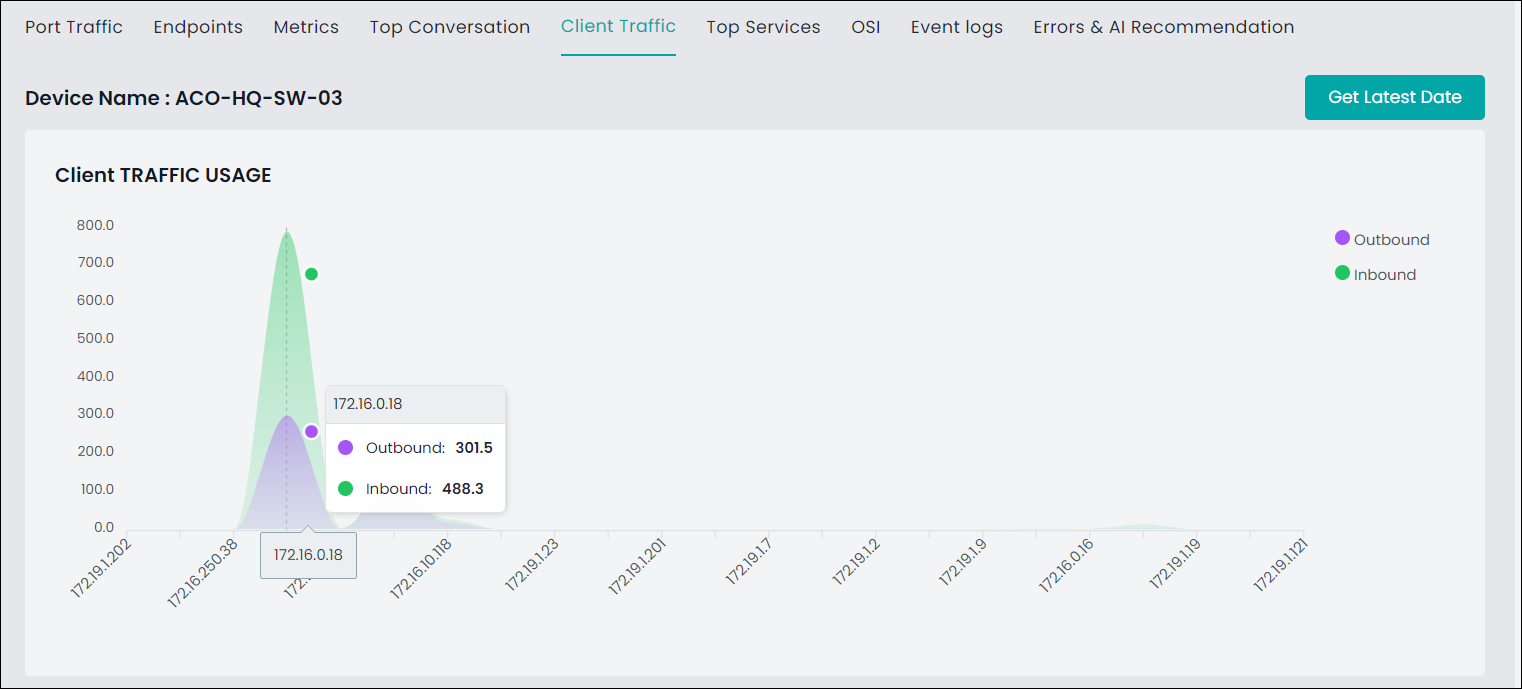
Client Traffic Usage Chart
This section represents a graphical view of the traffic usage on the selected device for different clients over a range of IP addresses.
The statistical data of inbound and outbound traffic usage for a specific client is displayed upon hovering over the chart.
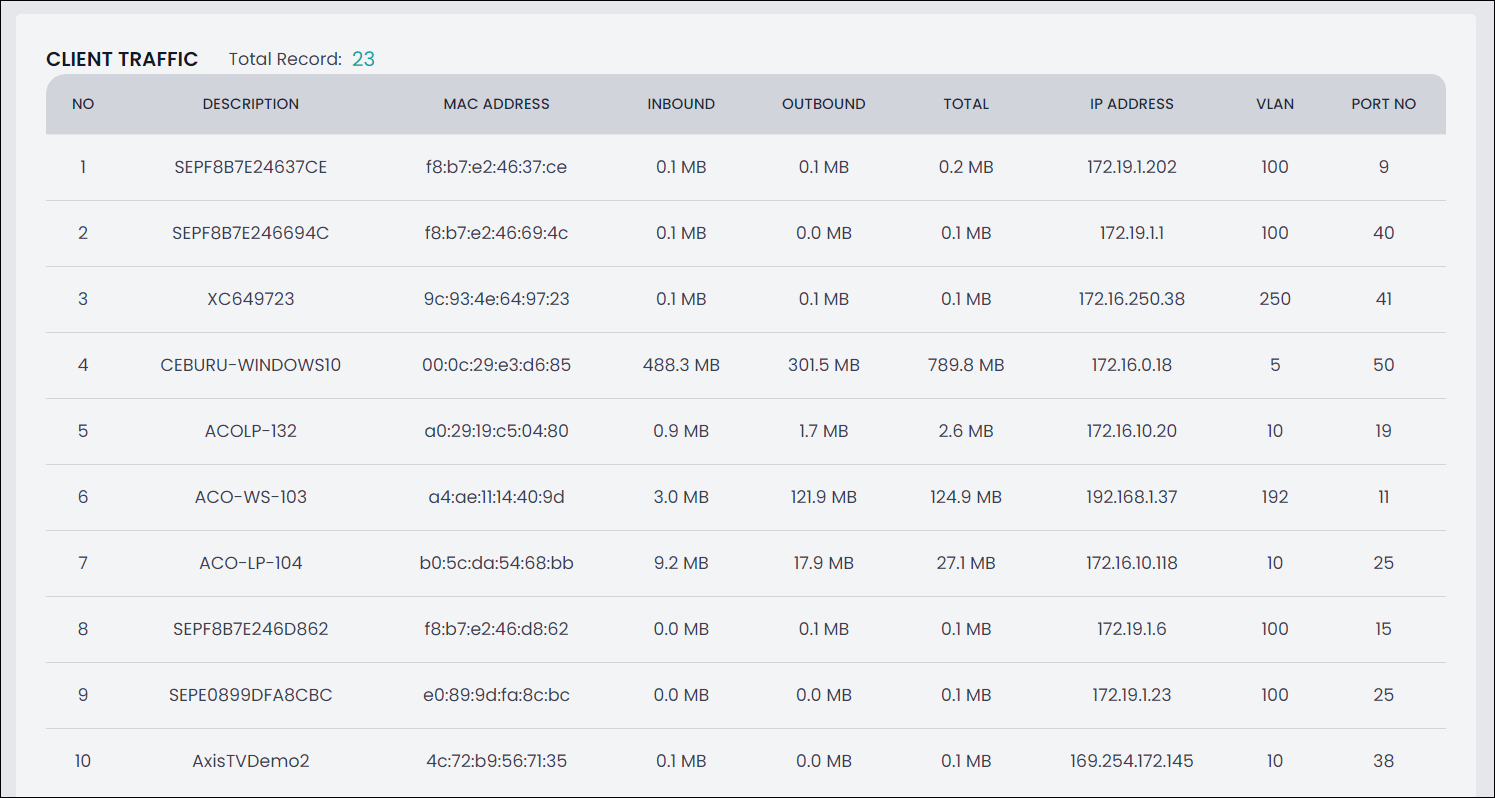
Client Traffic Details
This section displays a table listing the details of individual client traffic records for the selected device, including the amount of inbound, outbound, and total traffic in megabytes, the IP address of the clients, VLAN identifiers associated with the client device, and port number associated with the traffic.
Top Services
The Top Services tab displays the top service usage data for the selected device over a defined period. It consists of two main sections:
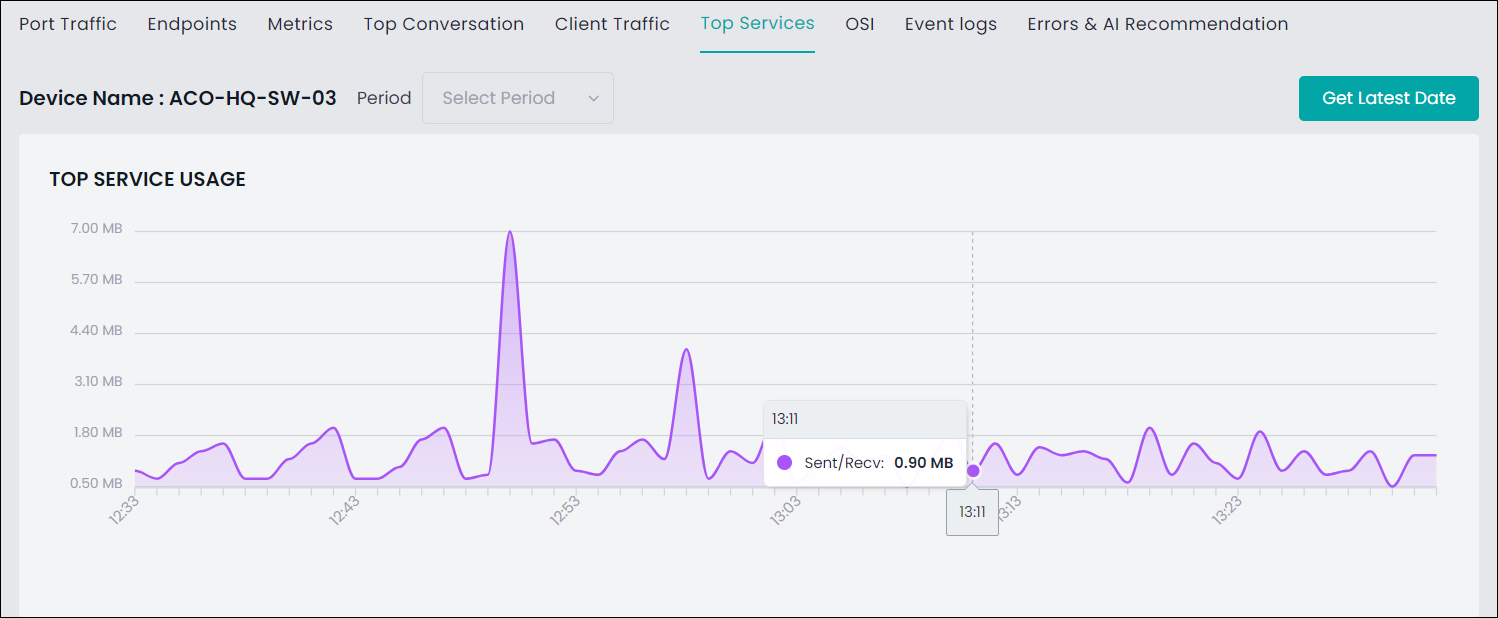
Top Service Usage Chart
This section displays a chart representing the volume of data sent and received by different services over time.
Upon hovering over the chart, the statistical information about the amount of data sent and received at a specific time is displayed.
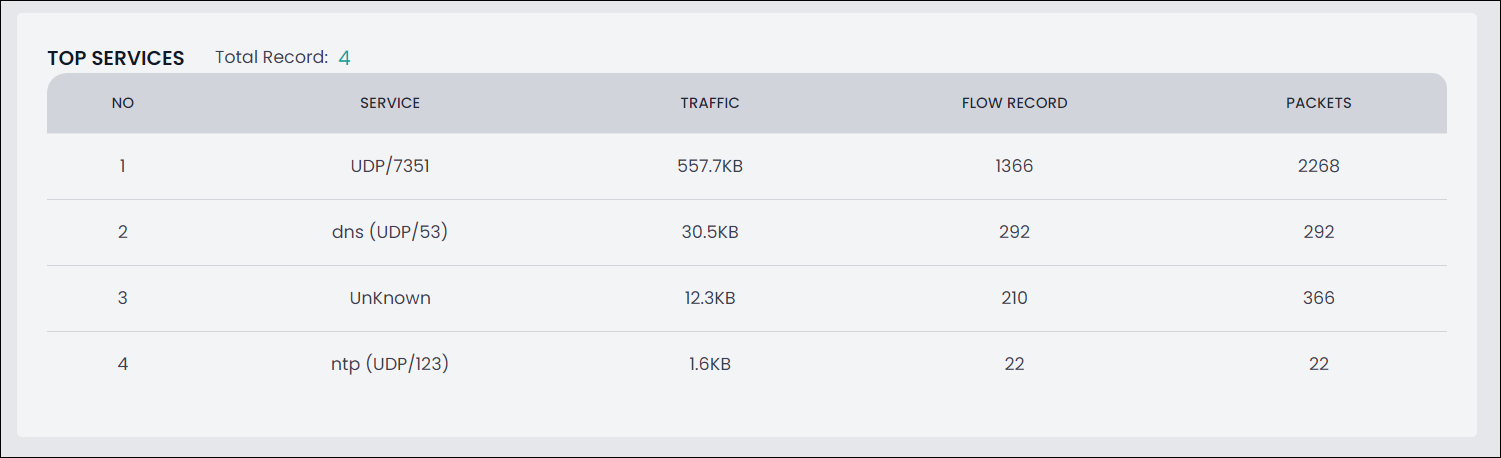
Top Services Details
This section displays a table listing the details of the top services used, including the name or type of the service and the amount of data transferred by the services in kilobytes with the respective flow records and packets used.
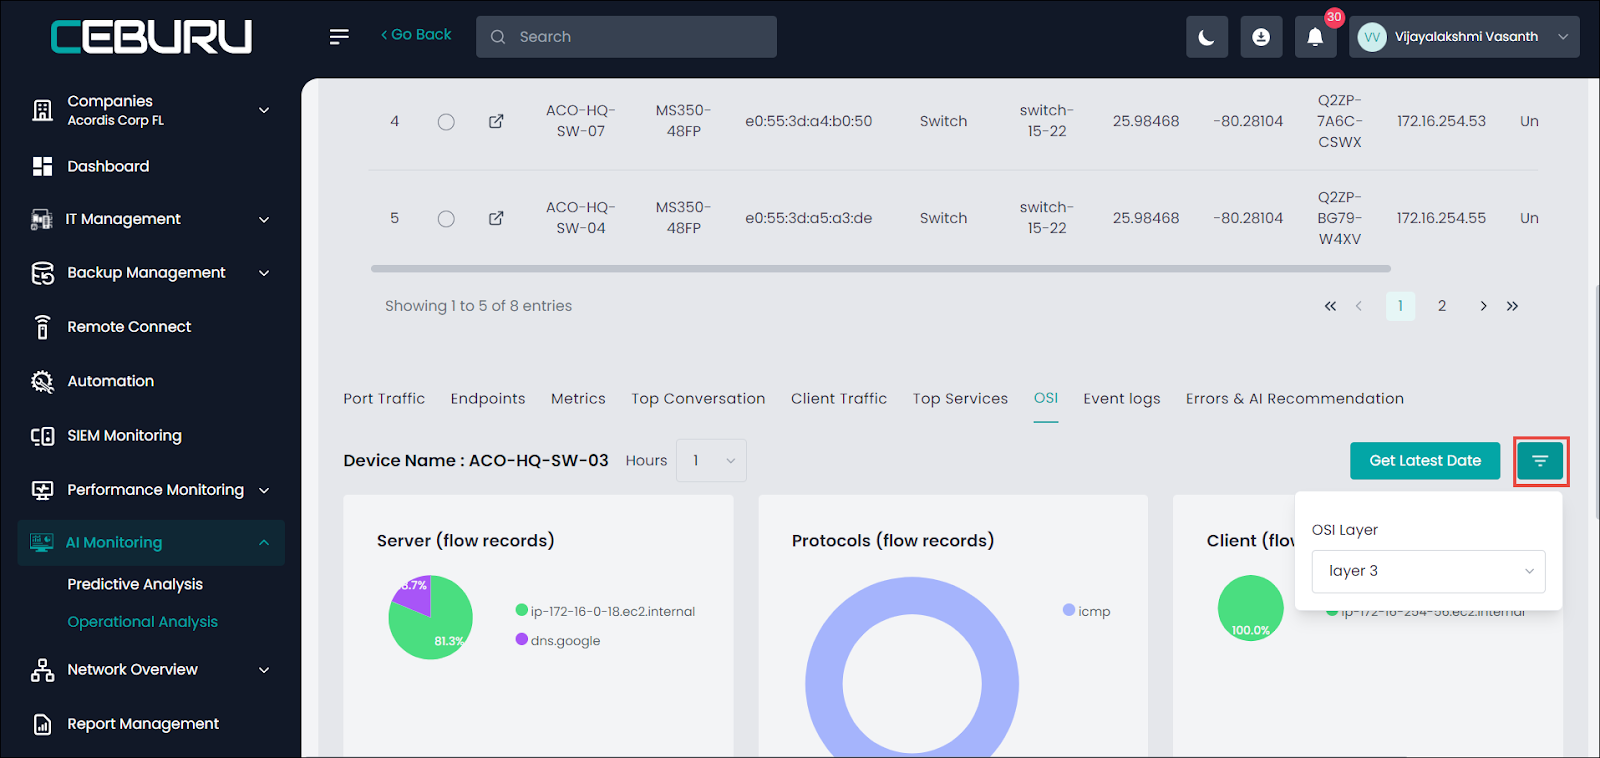
OSI
The OSI section displays graphical representations of data regarding network traffic and communication protocols based on the Open Systems Interconnection (OSI) model's seven layers, from physical transmission to application-level data exchange. Using this data, you can identify and troubleshoot issues at each layer, ensuring efficient and secure network performance for individual devices.
You can view data in the OSI section as various graphs for an individual device using the filter option to select a specific OSI Layer.
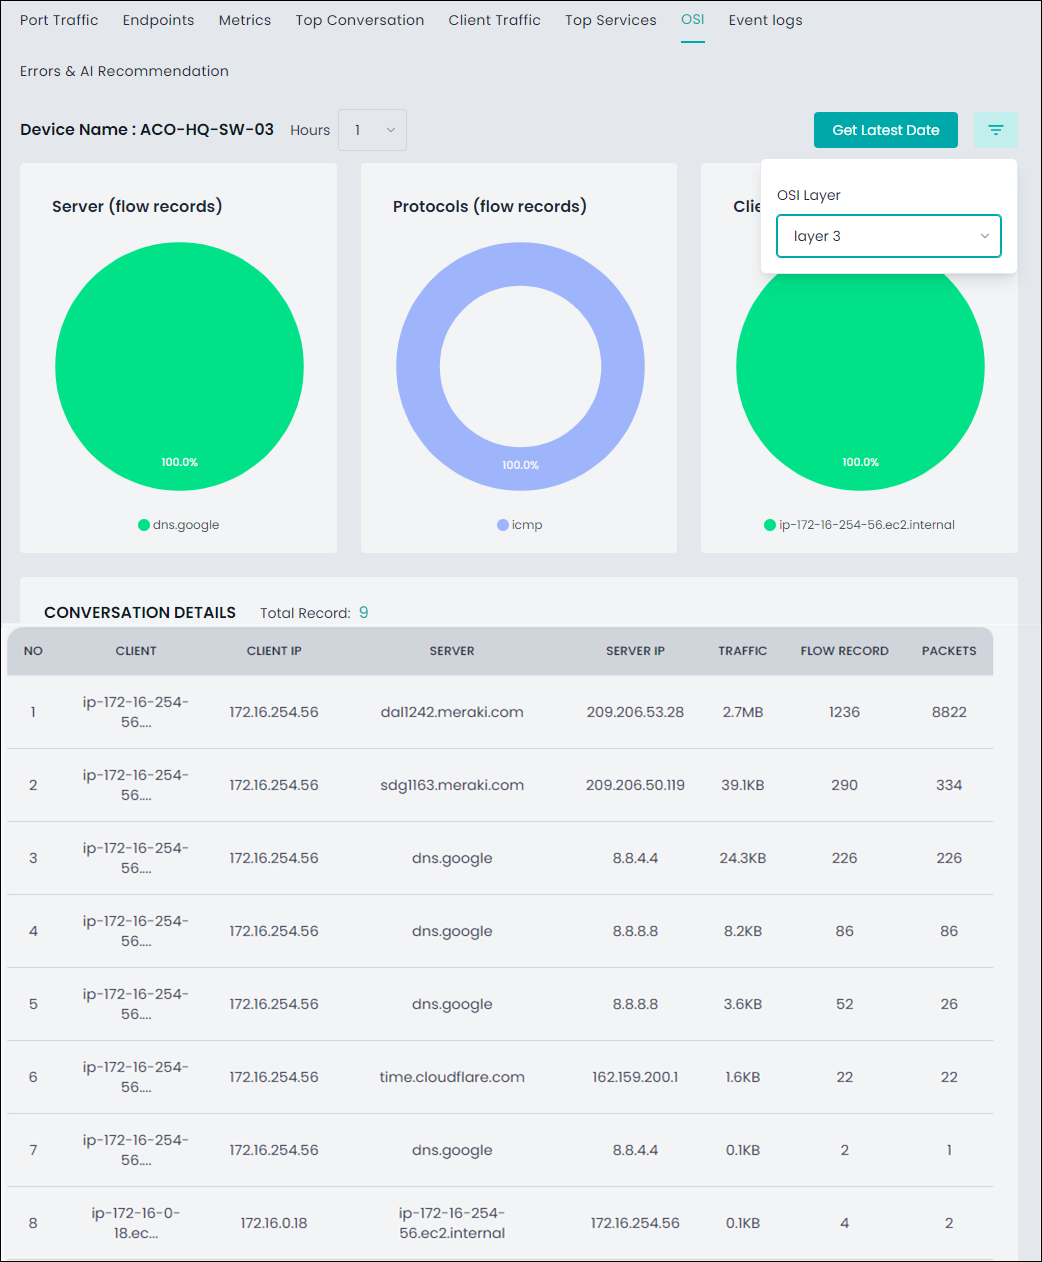
Layer 3
The Layer 3 data shows graphical and tabular representations of network flow data for a selected device as follows:
The Server (flow records) displays a pie chart showing the distribution of traffic to different servers.
The Protocols (flow records) display a chart to show the protocol used in the traffic.
The Client (flow records) displays a pie chart showing all traffic is from specific clients with the related IP addresses.
The Conversation Details section provides a tabular format of detailed information about the network conversations.
Layer 4
The Layer 4 filter displays detailed network data for the selected device, enabling you to monitor traffic and protocols used on networks and the volume and patterns of data flow.
The Layer-4 Protocols (flow records) card displays a pie chart that shows the distribution of different Layer-4 protocols observed in the network traffic such as UDP (User Datagram Protocol) and ICMP (Internet Control Message Protocol).
The Layer-4 Protocols (bits/s) card displays a line graph that shows the traffic volume in bits per second for the Layer-4 protocols over time.
The IP Versions (flow records) card displays a donut chart showing the distribution of traffic based on IP versions.
The IP Versions (bits/s) card displays a line graph illustrating the data rate (in bits per second) for different IP versions over time.

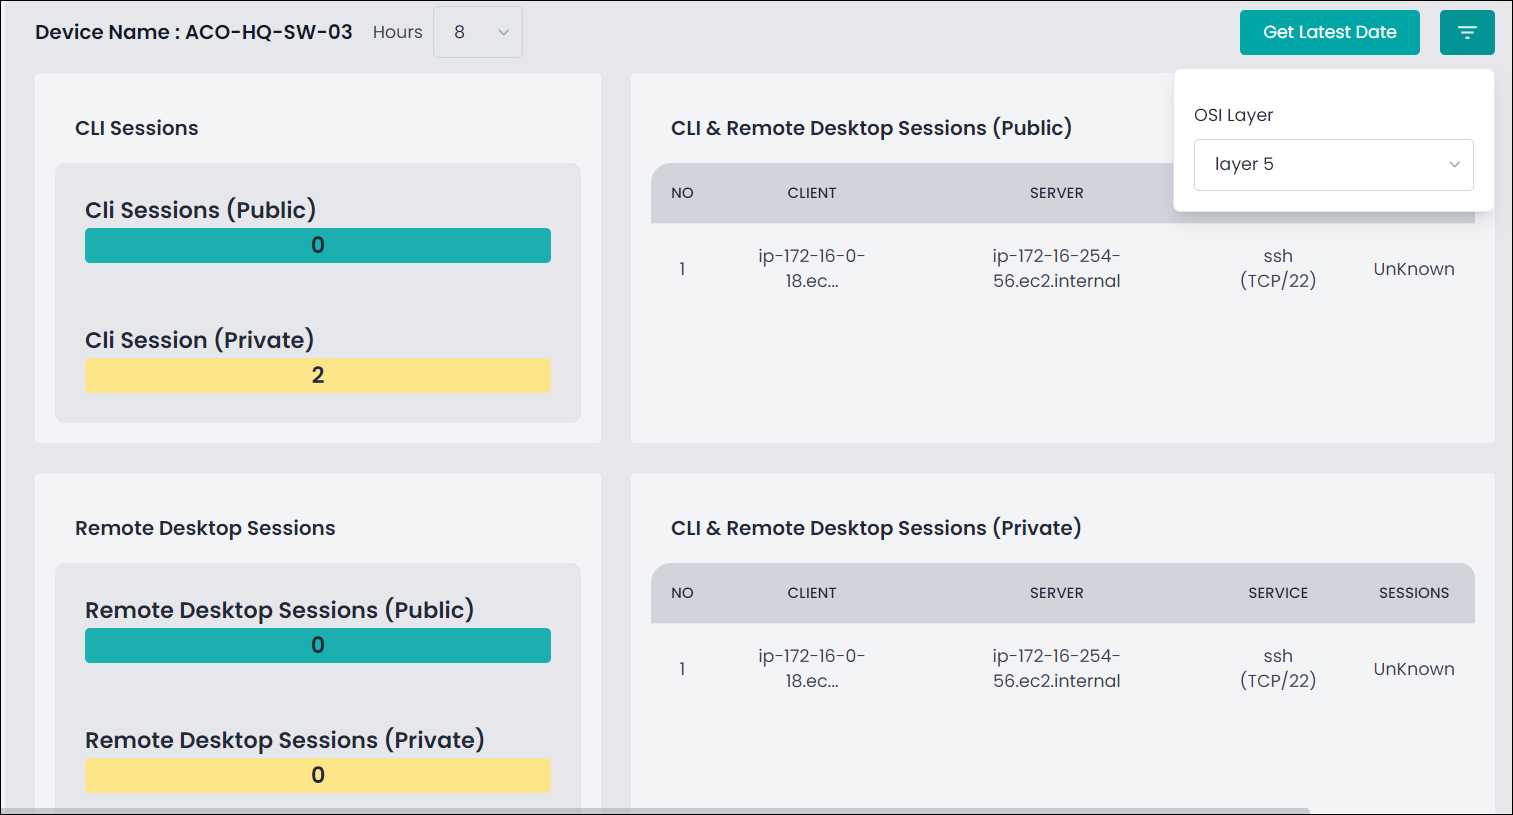
Layer 5:
The Layer 5 filter displays data of CLI (Command Line Interface) and Remote Desktop Sessions for the selected device to monitor and track CLI and remote desktop activities on the networks.
The CLI Sessions card displays the CLI Sessions (Public) data indicating the number of public CLI sessions and the CLI Sessions (Private) data indicating the number of private CLI sessions.
The CLI & Remote Desktop Sessions (Public) card lists the public CLI and remote desktop sessions.
The Remote Desktop Sessions card displays Remote Desktop Sessions (Public) indicating the number of public remote desktop sessions and the Remote Desktop Sessions (Private) indicating the number of private remote desktop sessions.
The CLI & Remote Desktop Sessions (Private) card displays details on private sessions such as the client IP, server IP, service used, and number of sessions.
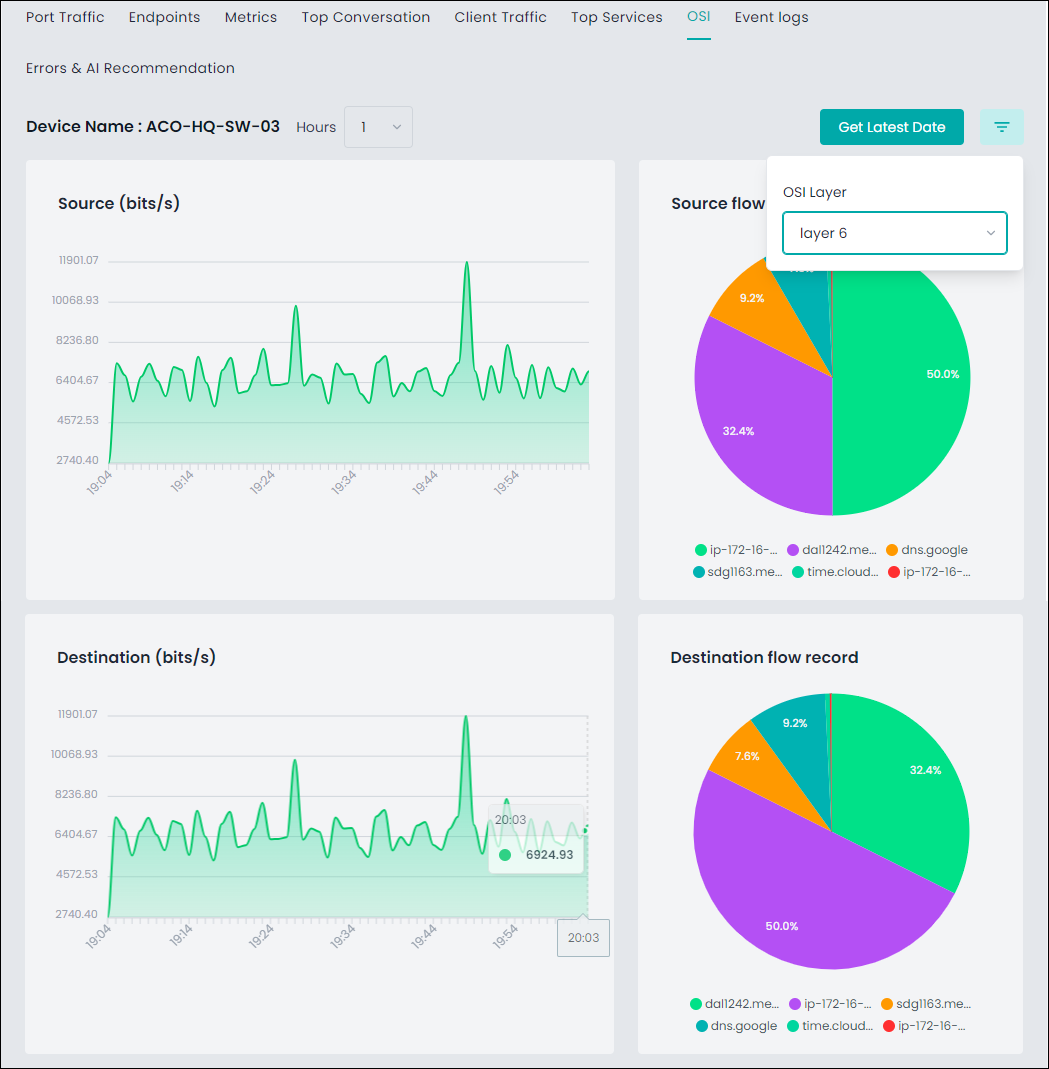
Layer 6
The Layer 6 of the OSI section displays information on the data transmitted from the selected device on a specific network.
The Source (bits/s) card is a graphical representation of the data transmission rate from the selected device measured in bits per second.
The Source Flow Record card displays a pie chart showing the data flow originating from a specific IP address on the selected device.
The Destination (bits/s) displays the rate at which data is received by the selected device and is measured in bits per second (bps).
The Destination Flow Record displays a pie chart showing details about the data flow for a particular destination.
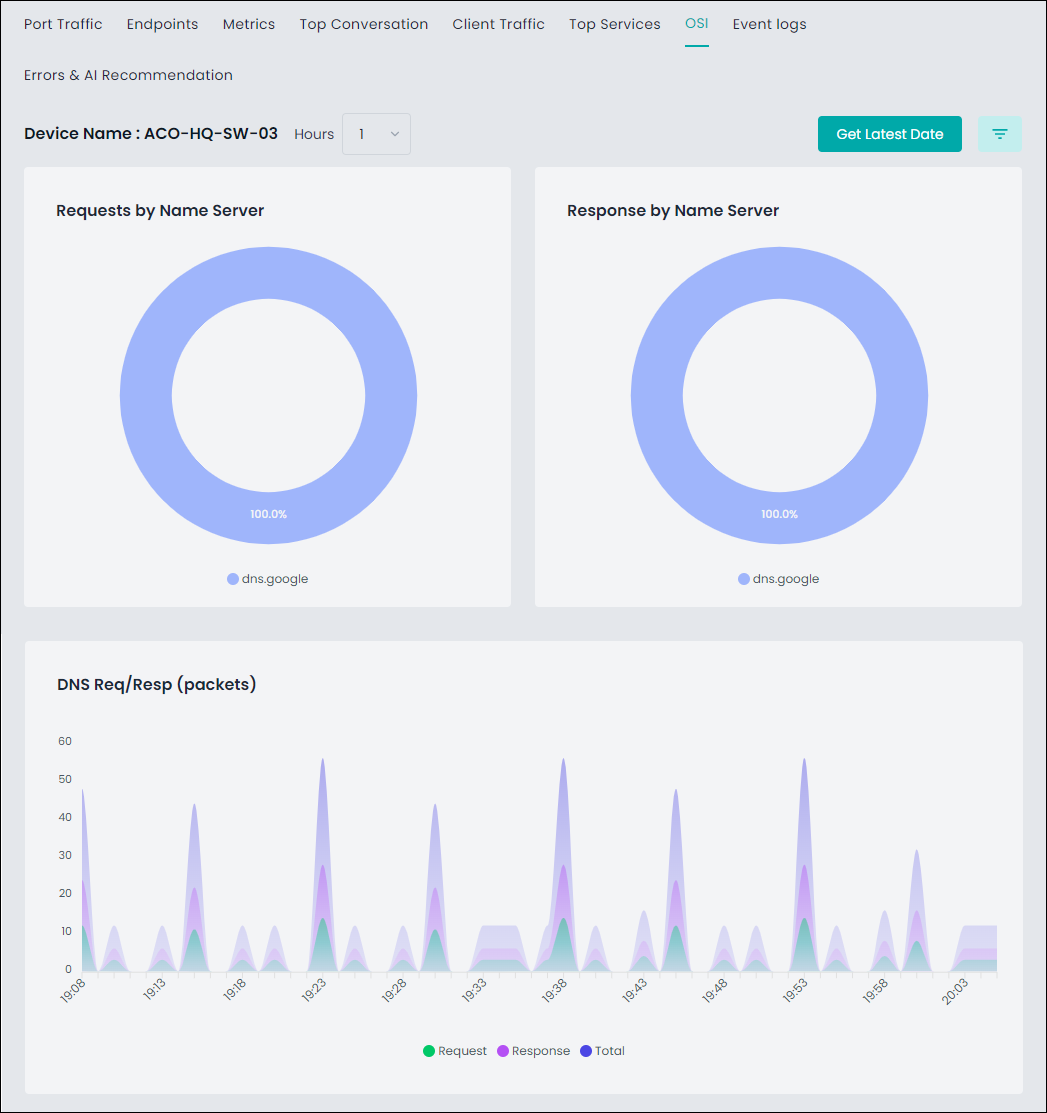
Layer 7
The Layer 7 displays data for a selected device providing network services directly to end-user applications over a chosen period.
The Requests by Name Server card displays a doughnut chart representing the number of DNS queries sent by a DNS server via the selected device.
The Response by Name Server card displays a doughnut chart indicating the number of responses a DNS server provides to DNS queries via the selected device.
The DNS Req/Resp (packets) card displays the number of DNS requests and response packets exchanged between DNS clients and servers for the selected device.
Event Logs
The Events Log tab provides data for monitoring and troubleshooting your network, including the timestamp of when the event occurred, description of the event, specific switch, specific port on the switch where the event occurred, event type, and event category.

Errors & AI Recommendation
The Errors & AI Recommendation tab provides data for events or alerts that indicate problems or issues within the network and suggestions generated by Meraki’s AI.

Was this article helpful?
That’s Great!
Thank you for your feedback
Sorry! We couldn't be helpful
Thank you for your feedback
Feedback sent
We appreciate your effort and will try to fix the article